From COCOMO to contributor leverage: measuring T3 Code with Camp
I built camp leverage because I wanted a standardized way to measure the effectiveness of AI development. How do I compare my results with someone else’s when we’re building different things and aiming for different outcomes? How do I compare my own results over time?
I wanted a metric that other developers could use too, so we could compare repositories and our agentic development results with each other using the same calculation and visible assumptions. That’s why I’m sharing it here. It’s not perfect, but I think having a shared metric is better than having no measurement at all.
On June 15, 2025, I published $1 Million Per Week: My Seven-Week AI Development Sprint. That was where I first wrote about using COCOMO to put my AI-assisted development output in context. I used scc to scan the code and compare a conventional development estimate with the time and resources I had spent building it.
The code-only report in that post counted 219,400 lines and estimated a team of 23.01 people working for 29.96 months. That comparison gave me a way to discuss the scale of the work beyond saying that AI made development feel faster.
camp leverage turns that measurement idea into a repeatable command and extends it to individual contributors. I’ll use T3 Code to show how the metric works and how to read the results, so you can run it on your own repositories and compare results with your peers. You can also repeat it over time to track your own results. In either case, consistent scope rules and assumptions matter to the comparison.
What camp leverage measures
Camp is a CLI for organizing development projects and their working context. It ships with Festival, the open-source toolkit I build for organizing and running agentic development. Its leverage command analyzes a Git repository using two sources: a conventional effort estimate from scc, and ownership and timing information from Git. It works directly on a local checkout.
COCOMO stands for Constructive Cost Model. It estimates development effort from software size and model assumptions. scc supplies an estimated team size and schedule; Camp multiplies them to obtain person-months, abbreviated PM. For example, a model estimate of four people working for six months is 24 person-months of effort.
For a contributor breakdown, Camp then:
- Estimates the counted source tree.
sccscans the selected files and returns the COCOMO estimate. Ignore rules determine which files enter the calculation. - Allocates the estimate by surviving line ownership. Git blame identifies the authors of the current lines. An author owning 10% of counted physical lines receives 10% of the repository’s estimated person-months.
- Divides by a commit-span proxy. Camp uses the calendar span between that author’s first and last commits, with a minimum of 0.1 months, as the effort denominator.
contributor leverage = allocated estimated person-months / commit-span person-months
A 10x result means the allocated model estimate is ten times that calendar-span proxy. The repository summary uses a blame-weighted effort calculation, while the contributor view lets you inspect each person’s allocation and denominator. Neither denominator is a timesheet; the exact assumptions matter when interpreting the result.
Applying the measurement to T3 Code
I ran Camp against T3 Code on November 8, 2026, excluding the imported .repos/ tree.
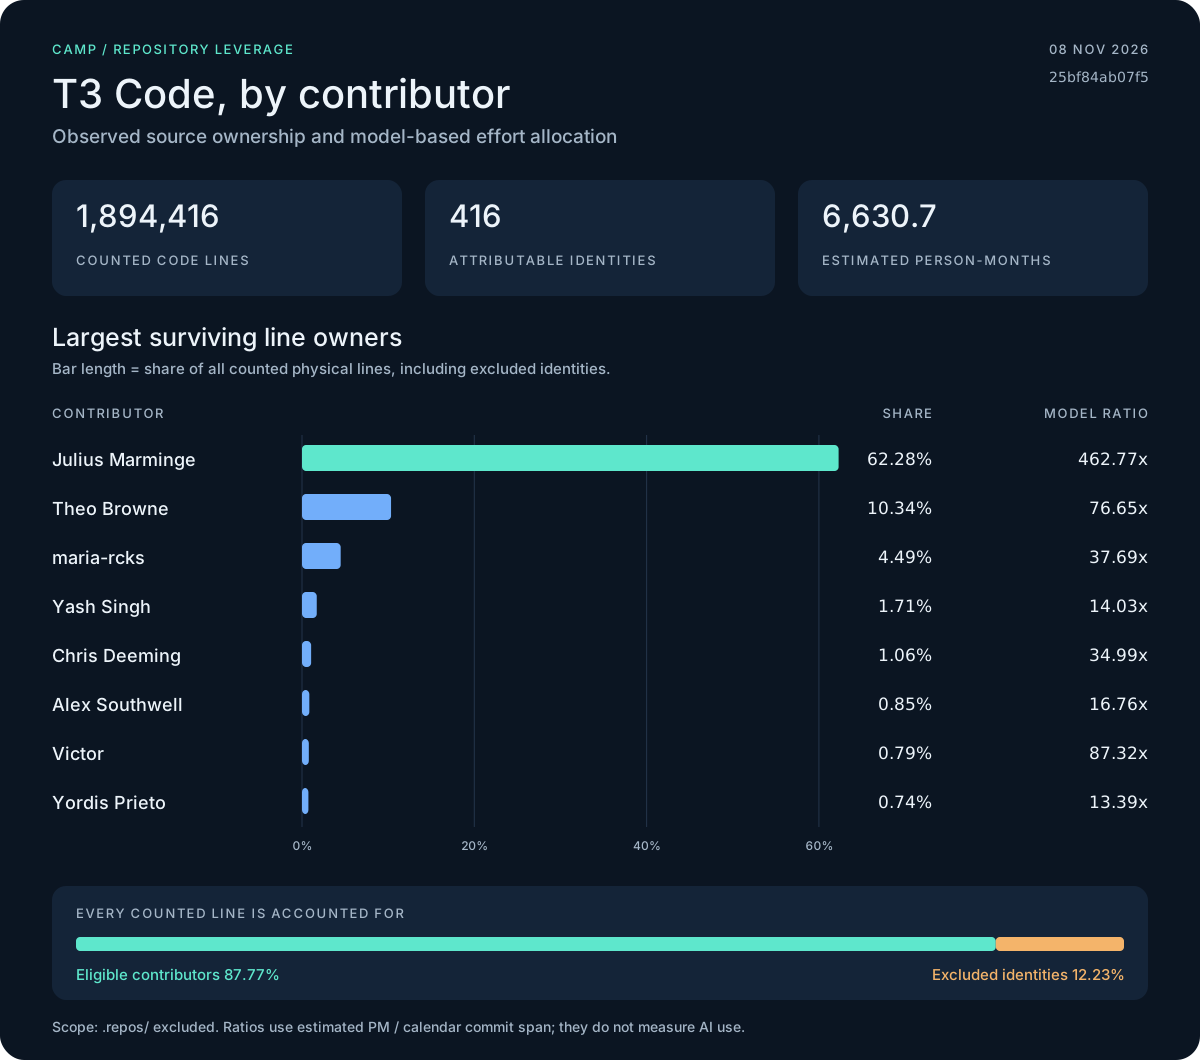
Two contributors account for 72.62% of the counted physical lines in this snapshot. The full report contains 416 attributable identities, with 12.23% of counted lines kept in a separate excluded-identity bucket. The chart shows the largest line owners and their calculated ratios side by side.
The repository snapshot
| Measurement | Result |
|---|---|
| Files counted | 7,198 |
| Code lines counted | 1,894,416 |
| Physical lines used for ownership shares | 2,101,875 |
| Attributable contributor identities | 416 |
| COCOMO estimated effort | 6,630.72 person-months |
| Repository ratio, using blame-weighted effort | 947.64x |
Scope: revision 25bf84ab07f5, .repos/ excluded. Tools: Camp v0.18.2 build 02edf487, scc 4.1.0. The summary, personal and contributor views all completed with the same scope fingerprint.
The contributor breakdown
These are the ten largest owners of surviving counted lines. The table is sorted by physical lines. Share uses all counted physical lines as its denominator, including the excluded-identity bucket. PM means person-months; span PM is a calendar commit-span proxy.
| Contributor | Physical lines | Share | Estimated PM | Span PM | Ratio |
|---|---|---|---|---|---|
| Julius Marminge | 1,309,143 | 62.28% | 4,129.91 | 8.92 | 462.77x |
| Theo Browne | 217,255 | 10.34% | 685.37 | 8.94 | 76.65x |
| maria-rcks | 94,359 | 4.49% | 297.67 | 7.90 | 37.69x |
| Yash Singh | 35,992 | 1.71% | 113.54 | 8.09 | 14.03x |
| Chris Deeming | 22,283 | 1.06% | 70.30 | 2.01 | 34.99x |
| Alex Southwell | 17,869 | 0.85% | 56.37 | 3.36 | 16.76x |
| Victor | 16,634 | 0.79% | 52.47 | 0.60 | 87.32x |
| Yordis Prieto | 15,622 | 0.74% | 49.28 | 3.68 | 13.39x |
| Alex | 13,601 | 0.65% | 42.91 | 3.63 | 11.83x |
| Tristan Knight | 5,093 | 0.24% | 16.07 | 2.88 | 5.58x |
Download all 416 contributor rows as CSV. The snapshot metadata records the revision, scope fingerprint, tools and source-report checksum. Names are the display names in the Git-derived report; a row represents a resolved identity.
The table makes the arithmetic inspectable. Theo Browne owns 217,255 counted physical lines, a 10.34% share. Camp allocates 685.37 estimated person-months to that share and divides by an 8.94-month commit span:
685.367108 estimated PM / 8.941734 span PM ≈ 76.6481x
Running the personal view for that identity returned the same ratio as the contributor row, before rounding.
T3 Code is one of Theo’s projects, and it gives us a public repository for demonstrating camp leverage. His 76.65x result here covers his attributed lines in this checkout. The 8.94-month denominator is elapsed calendar time, rather than a record of time spent on T3 Code.
Julius Marminge’s 62.28% share receives a larger estimated allocation, 4,129.91 PM, over an 8.92-month span, producing 462.77x.
Where every line went
| Accounting bucket | Physical lines | Share | Allocated estimated PM |
|---|---|---|---|
| Eligible contributor identities | 1,844,714 | 87.77% | 5,819.46 |
| Excluded identities | 257,161 | 12.23% | 811.26 |
| Uncommitted source | 0 | 0.00% | 0.00 |
| Unavailable attribution | 0 | 0.00% | 0.00 |
| Total | 2,101,875 | 100.00% | 6,630.72 |
Camp leaves excluded identities’ allocation in that bucket. It does not redistribute those lines to the displayed contributors. In this run, every counted line was accounted for and no source lines were uncommitted. The checkout’s only pending change was the .sccignore file itself.
Install Festival and run your first report
Install Festival to get camp, fest, and the festival manager together. The reports here require Festival v0.3.31 or newer, which includes Camp v0.18.2 or newer. You’ll also need Git and scc, the code counter that supplies the effort estimate.
Choose one Festival installation method. On macOS with Homebrew:
brew install --cask Obedience-Corp/tap/festival
brew install scc
Or, on macOS or Linux with Node.js:
npm install -g @obedience-corp/festival
For the npm route, install scc separately using its installation guide. The Festival installation guide covers Windows and other package managers.
Check the installation:
festival doctor
camp version
scc --version
Then point Camp at a local Git checkout:
camp leverage /path/to/repo
camp leverage /path/to/repo --author [email protected]
camp leverage /path/to/repo --by-author
These select the repository summary, personal view and contributor breakdown. You can run these reports immediately after installation, without creating a camp or registering your project. Explicit-directory reports are read-only and support dirty working trees. New or modified uncommitted lines go into their own accounting bucket.
For the T3 Code run, the repository-root .sccignore contained:
.repos/
Camp uses the file list from the same scc scan that supplies its estimate, so that rule excludes the imported tree from both estimation and contributor attribution. Inspect generated and imported material elsewhere in your checkout too; excluding .repos/ does not audit the remaining source.
The default contributor table shows owners with at least 1% of counted physical lines. To export every attributable owner, including the smaller contributors in the table above:
camp leverage /path/to/repo \
  --by-author --author-threshold 0 --json \
  > /path/outside/repo/contributors.json
Keep exports outside the scanned tree. The threshold changes displayed rows without changing allocations. --json works for the summary and personal views as well. A partial report exits with code 2 and identifies the unavailable data; shallow history, for example, leaves affected ratios unavailable.
Read the ratio with its denominator
The date span uses earliest-to-latest committer dates across local Git refs. It can include commits that touched files outside the current counted source. A short span, including the 0.1-month floor for a single-commit author, can produce a large ratio even for a small allocation. The repository summary uses a different, blame-weighted denominator; individual ratios must not be summed to reproduce it.
These numbers do not establish that T3 Code’s developers were 947.64 times faster because of AI. The run did not independently classify every remaining file as generated or human-authored, and Git cannot supply actual working hours, review effort, quality, or proof of AI use. Use this report alongside what you know about the team’s tools and delivered work, and keep scope and versions consistent when comparing snapshots.
These reporting features are included in Festival v0.3.31, which bundles Camp v0.18.2. See the Camp repository reporting guide for command details.
Compare your results
My first COCOMO report gave me a way to put my own AI-assisted development into context. With Camp, I can apply that same measurement approach to a public project like T3 Code, inspect the individual contributions, and share enough detail for someone else to reproduce the calculation. That makes the comparison available to anyone with a repository to measure.
The useful next step is to put those reports next to each other. Run it on something you’ve built and compare it with a peer’s report. Share the revision, exclusions and tool versions along with the ratio, and talk about what you built and how you used agents to build it. When the results differ, those details give you somewhere to start looking for an explanation. Save your report so you can make the same comparison with your own work later.
That’s what I want people to do with this measurement. We can use a shared, imperfect metric to compare our agentic development results now, and use what we learn from those comparisons to improve how we measure them.
Get Festival on GitHub, install the tools, and run your first report on a repository you know well. Share it with a peer alongside what you built and how you used agents to build it.